
VAERS is the CDC’s Vaccine Adverse Event Reporting System. It opened in 1990, but would accept reports on events from as much as 10 years prior.
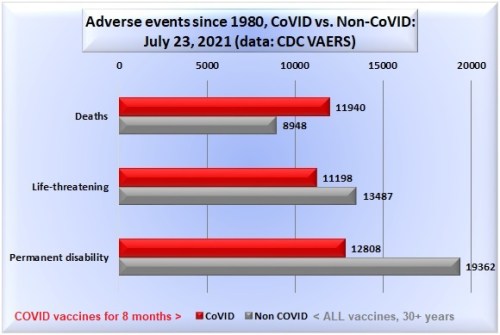
- All non-COVID vaccines for 30+ years: The gray bars on the graph represent the total numbers of VAERS reports for ALL non-COVID vaccines from 1990+ through July 23, 2021.
- COVID vaccines for 8 months: The red bar represents all the VAERS reports for the COVID-19 vaccines that got emergency approval for use in the USA from mid-December 2021 through July 23, 2021.
I went to the VAERS website and attempted to reproduce the results on the bar graph. Despite the fact that the site says the end dates are still July 23, I got different numbers. However, the point the graph is making remains the same – i.e., the experimental COVID vaccines are far more dangerous than any FDA approved vaccine. Here are my results.
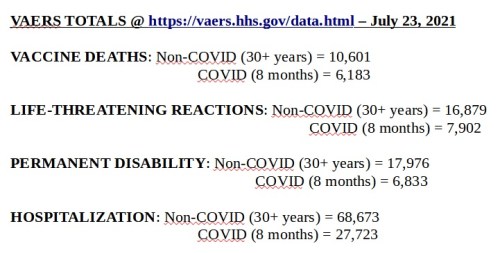
I also tried to suss out what the numbers mean, given the huge number of COVID vaccinations that have occurred in this eight month period. This was complicated by the fact that VAERS is voluntary and the level of reporting is low, so the actual numbers are certainly higher. In addition, there’s no way of telling how many total doses of any vaccine was administered. All they give is a percentage of the total 1,146,536 reports they have recorded. Still, the percentages are telling, especially when compared with other vaccines. It should be noted that all the COVID vaccines are lumped together, while vaccines for other diseases often list various versions, some of which are much safer than others.

You can look at this stuff yourself by going to the VAERS link below, click “Search CDC WONDER”, choose “AGREE.” Then you can choose the “Request Form” tab on the top left. I chose “Group results by Event Category” and by “Vaccine.”


Thank you very much for the pingback!
I understand the challenge in learning the Wonder system (the query system for VAERS). It took me a few weeks to learn this. You start here:
https://wonder.cdc.gov/vaers.html
As you said, you first click “I Agree”. Then you customize your query by clicking on the “Request Form” tab.
In “1. Organize table layout”, open the first drop-down menu “Group results by”, and choose “Event category”.
In “3. Select vaccine characteristics”, click on “COVID19”.
In “4. Select location, age, gender”, click on “All locations”. (This will make the biggest difference for your result. Many reports are incomplete and leave out either dates or locations.)
In “5. Select other event characteristics”, you can leave that alone; I chose to focus only on death, life-threatening, and permanent disability. They will be included in the final report in any case.
At the bottom of the page, click “Send”. Your report will be generated within seconds. I can see the numbers I reported in the chart above.
Good luck!
LikeLiked by 1 person